

In 2024, life expectancy in the United States was 79 years, an increase of 0.6 years from 2023 figures. Yet American health depends on far more than any single factor, with access to healthcare, lifestyle habits, chronic disease rates, environmental factors, and preventive care all playing a key role.
In this study, we rank (as part of the Suzuki State Health Index) the healthiest and least healthy states in America by analyzing a range of public health indicators. We’ll identify where residents enjoy the best overall health and quality of life during a period when the U.S. Government has ramped up its efforts to combat federal healthcare fraud.
Let’s start by taking a look at the index to confirm which states are ranked highest (and lowest) for healthy living in the United States.
The Healthiest U.S. States
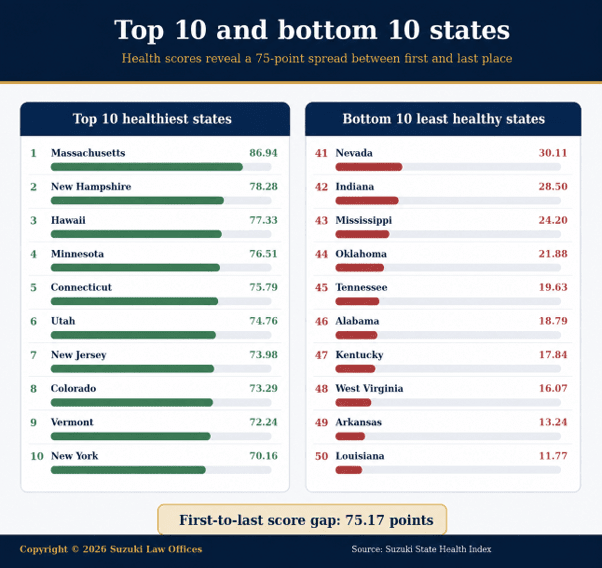
Our research reveals that Massachusetts is the top-ranking state for the healthiest Americans. Its score of 86.94 gives it a significant leading margin, with no other state earning a score over 80. New Hampshire (78.28), Hawaii (77.33), Minnesota (76.51), and Connecticut (75.79) make up the remainder of the top five, with Utah, New Jersey, Colorado, Vermont, and New York completing the top 10.
At the opposite end of the index, Louisiana ranks 50th and last with a score of 11.77, with Arkansas (13.24), West Virginia (16.07), Kentucky (17.84), and Alabama (18.79) completing the bottom five. The gap between Massachusetts and Louisiana (over 75 points) starkly emphasizes the scale of the differences captured by the index, and the gulf between health extremities in the United States.
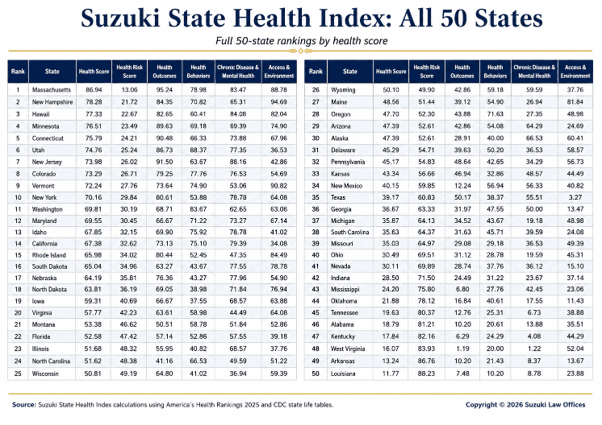
The geographic pattern is very clear, with six of the 10 highest-ranked states in the Northeast, and eight of the bottom 10 in the South. That disparity tells us that the index represents a clear indication of a broad regional divide, not just the illustration of a state-by-state differential.
Life expectancy broadly supports the regional pattern. On this count, Hawaii leads the nation (80 years), followed by Massachusetts (79.8), while West Virginia is among the lowest life-expectancy states (72.2 years). (Arizona ranks 29th overall, with a Health Score of 47.39 and a Health Risk Score of 52.61.)
The composite index ranking is designed to show that state health is multidimensional. A state can perform strongly in one area while struggling in another, making the combination of the four categorical pillars key to understanding a state’s place in the overall standings.
States With The Healthiest Habits
Health behaviors are one of the clearest state differentials. Utah leads the Health Behaviors pillar with 88.37 points, followed by Washington (83.67) and Massachusetts (78.98). Colorado, Idaho, California, Vermont, Oregon, Maryland, and New Hampshire complete the top 10.
At the bottom, Louisiana scores just 10.2, followed by West Virginia (20) and Alabama (20.61). Arkansas, Kentucky, Tennessee, Mississippi, Ohio, Missouri, and Indiana complete the bottom 10.
Obesity and physical inactivity represent some of the clearest reasons for the divide between high- and low-ranked states. Adult obesity ranges from 25% in Colorado to 41.4% in West Virginia. Physical inactivity ranges from 15.6% in Colorado to 30.6% in Mississippi, with the highest inactivity rates generally an issue for states with weaker overall health-behavior scores.
Smoking adds another important layer to the health behavior equation. Rates range from 5.7% in Utah to 20.8% in West Virginia, a broad gap that clearly illustrates why Utah and West Virginia sit at opposite ends of the Health Behaviors pillar.
Yet it’s worth emphasizing: no single behavior determines a state’s overall health score. Hawaii exemplifies the point: despite ranking No. 3 overall, 45.6% of Hawaii’s residents report insufficient sleep, showing that even highly ranked states can suffer significant health issues.
Other measures reinforce the broader pattern. The share of adults who meet federal aerobic and strength guidelines ranges from 35.4% in Colorado to 20.6% in West Virginia, while daily fruit and vegetable consumption ranges from 12.9% in Vermont to 3.8% in Oklahoma. Additionally, the use of adult e-cigarettes ranges from 5.1% in Maryland to 10.8% in Oklahoma.
Excessive drinking is another factor that’s often a standalone issue in otherwise well-performing states. Montana records the highest rate at 22.5%, while Utah records the lowest at 11.9%.
Chronic Disease and Mental Health
The Chronic Disease & Mental Health pillar reveals another major divide. New Jersey ranks first with 88.16 points, followed by Hawaii (84.08) and Massachusetts (83.47). California, New York, Idaho, Nebraska, South Dakota, Utah, and Colorado complete the top 10.
West Virginia ranks last with just 1.22 points, followed by Kentucky (4.08) and Tennessee (6.73). Arkansas, Louisiana, Alabama, Oklahoma, Michigan, Ohio, and Indiana make up the rest of the bottom 10.
West Virginia provides the clearest example of how multiple combined health burdens can compound issues. Diagnosed diabetes affects 18.4% of adults in the state, compared with 8.4% in Colorado. Cardiovascular disease ranges from 6.6% in Utah to 14.2% in West Virginia, while the share of adults who live with multiple chronic conditions ranges from 8.1% in California to 20.6% in West Virginia.
Mental health follows a similar pattern. Depression rates range from 13.3% in New Jersey to 30.2% in West Virginia, while frequent mental distress ranges from 12.6% in Hawaii and North Dakota to 19.9% in Arkansas.
Other chronic conditions reinforce the contrast. High blood pressure levels range from 27.3% in Colorado and Utah to 46% in Mississippi, while high cholesterol ranges from 31.2% in Utah to 45% in West Virginia. COPD ranges from 4% in California and Utah to 12.6% in West Virginia, and chronic kidney disease ranges from 2.8% in Vermont to 5.8% in West Virginia.
The national picture underscores why this remains an important health challenge. The share of adults who report three or more chronic conditions rose from 10.7% to 11.3% between 2023 and 2024; over the same period, cardiovascular disease and chronic kidney disease each increased by 8%, with arthritis, asthma, cancer, diabetes, and COPD also becoming more prevalent.
Meanwhile, the supply of mental health providers increased 5% across the U.S. between September 2024 and September 2025, although availability still varied substantially by state.
How Healthcare Access and Environment Shape Health
Health doesn’t solely depend on individual choices or disease rates. Access to medical care, insurance coverage, and broader living conditions also contribute to a state’s overall health profile.
New Hampshire ranks first regarding Access & Environment (94.69 points), followed by Vermont (90.82) and Massachusetts (88.78). Rhode Island, Hawaii, Maine, South Dakota, North Dakota, Minnesota, and Connecticut also rank as one of the top 10 states.
Texas ranks last with only 3.27 points, followed by Oklahoma (11.43) and Georgia (13.47). Arkansas, Nevada, Mississippi, Louisiana, South Carolina, Arizona, and California also rank among the bottom 10 states.
Texas offers a notable contrast. The state’s uninsured rate is 16.7%, compared with just 2.8% in Massachusetts. The share of adults avoiding medical care because of cost ranges from 6.4% in Hawaii to 17.4% in Texas, while primary-care availability ranges from 400.2 providers per 100,000 residents in Massachusetts to just 225.0 in Texas.
Environmental and economic conditions are another important factor. Fine-particle air pollution ranges from 4.1 µg/m³ in Wyoming to 11.7 µg/m³ in California, while food insecurity ranges from 7.4% in New Hampshire to 18.9% in Arkansas. These measures are a key means of encapsulating a state’s broader environment, beyond healthcare access rates.
That’s not to say that national access levels are consistent: in 2024, Massachusetts had a 97.2% coverage rate, compared with 80.8% in Texas (the national average was 91.8%). Northeast states generally exceeded 95% coverage, compared with roughly 88% across Southern states.
Provider availability remains an important national challenge. HRSA estimates that 92.3 million Americans live in areas featuring insufficient numbers of healthcare practitioners. And while the national supply of mental health providers increased 5%, shortages remain severe in rural areas.
What America’s Healthiest States Have in Common
The four health measurement pillars reveal that the healthiest states tend to succeed across several dimensions rather than relying on one exceptionally strong factor.
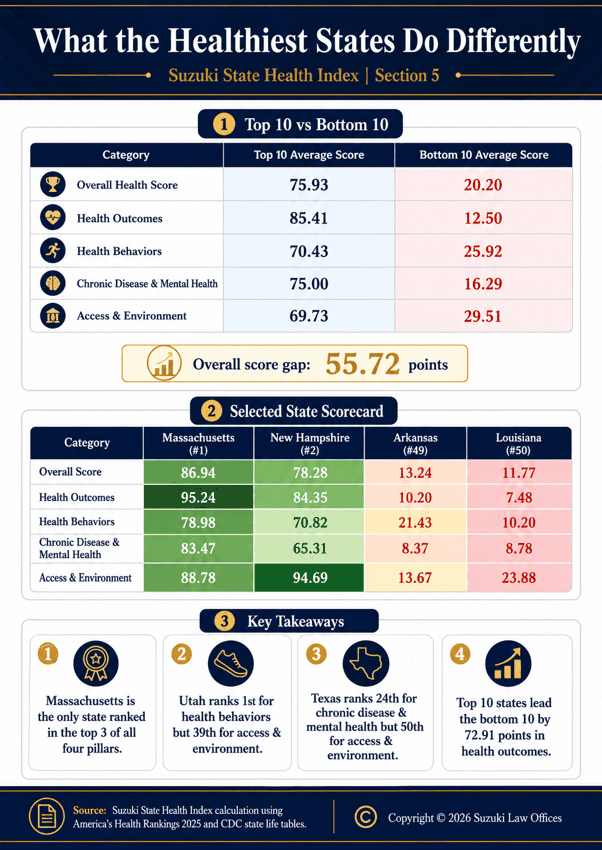
The Health Outcomes measure produced the largest gap between the top and bottom 10 states. The top group averages 85.41 points, compared with a 12.50 average among the bottom 10. The gap is also substantial for Chronic Disease & Mental Health (58.71 points), Health Behaviors (44.51), and Access & Environment (40.22).
Massachusetts is the clearest example of a balanced health profile. It is the only state to rank in the top three across all four pillars, a consistent performance level that clarifies why its overall Health Score of 86.94 is so far ahead of any other state.
Utah demonstrates a different lesson: it ranks first for Health Behaviors but only 39th for Access & Environment. Texas presents another contrast, ranking 24th for Chronic Disease & Mental Health but 50th for Access & Environment, contributing to an overall ranking of 35th. Strong performance in one area is unlikely to offset weak performances elsewhere.
Preventive care further illustrates the advantage of states that perform well across multiple measures. Childhood immunization completion ranges from 83.1% in Massachusetts to 57.8% in Montana. Adult flu vaccination ranges from 53.7% in Massachusetts to 33% in Mississippi, while HPV vaccination ranges from 79.8% in Massachusetts to 39.1% in Mississippi. Combined cancer screening ranges from 75.2% in Rhode Island to 54.7% in Wyoming.
Arizona ranks 29th overall, with a Health Score of 47.39 and a Health Risk Score of 52.61
Overall, the highest-performing states tend to combine healthier lifestyles, low obesity and chronic disease rates, strong preventive care, broad insurance coverage, good levels of access to primary and mental healthcare, and fewer residents needing to delay treatment for cost reasons.
The index, therefore, represents a balanced combination of individual behavior and healthcare infrastructure rather than one single explanation for a population’s health.
America’s Healthiest States, Ranked
The gap between the healthiest and least healthy states in the United States is stark. Massachusetts ranks as America’s healthiest state with a Health Score of 86.94, while Louisiana ranks 50th at 11.77: a significant gap of more than 75 points.
That difference reflects multiple dimensions of population health, including outcomes, behaviors, chronic disease and mental health rates, healthcare access, and living conditions. The strongest states generally perform well across several pillars at once, while lower-ranked states often face weaknesses in multiple areas.
Ultimately, the Suzuki State Health Index makes it clear that long-term population health depends not on one isolated measure, but on the combination of healthier behaviors, stronger outcomes, and the systems and environments supporting residents. For states that are struggling, our index underscores the exact areas in each state that would benefit from a particular focus.
Do you need legal help? Immediate representation by a nationally recognized Phoenix criminal defense lawyer can make a significant difference to the outcome of your case.
Index Methodology
Suzuki State Health Index
| Index pillar | Weight | What it represents |
| Health Outcomes | 30% | Overall population health outcomes |
| Health Behaviors | 25% | Lifestyle and behavioral health risks |
| Chronic Disease & Mental Health | 25% | Physical disease burden and mental health |
| Access & Environment | 20% | Healthcare access and broader living conditions |
The Suzuki State Health Index uses 19 individual metrics across four pillars to produce scores for all 50 states, excluding Washington, D.C. Each state was designated a Health Score from 0 to 100, with a higher score representing stronger overall health performance. A corresponding Health Risk Score is derived as 100 minus the Health Score: higher risk scores indicate weaker overall performance.
The four pillars are weighted at 30% for Health Outcomes, 25% for Health Behaviors, 25% for Chronic Disease & Mental Health, and 20% for Access & Environment. The criteria are transparent editorial choices, and the resulting scores represent associations and comparative performance, not proof of causation.